

Audit logs are only available to users with the Admin role. See Role-based access control for more information about Porter roles.
Open audit logs
In the Porter dashboard, open Security and select the Audit logs tab.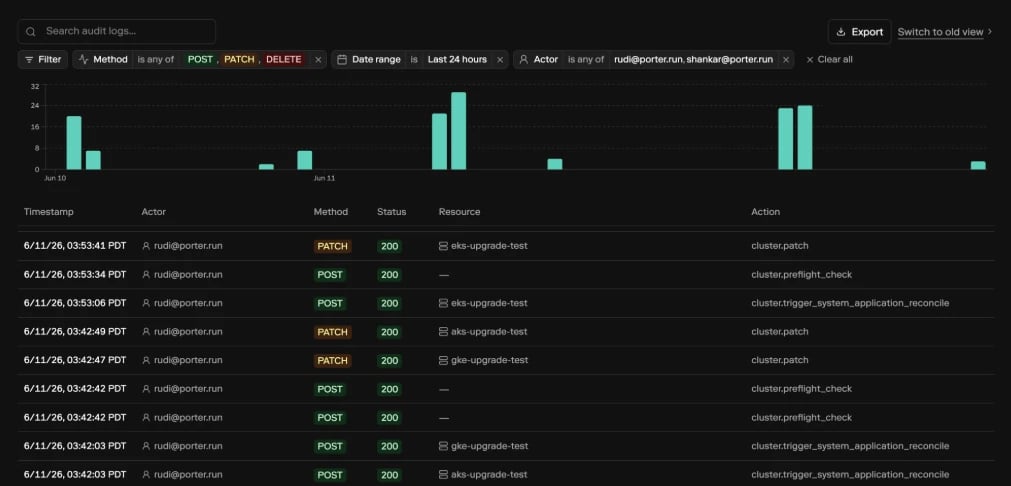
GET requests. This keeps the initial view focused on write operations such as creating, updating, deploying, and deleting resources. Clear the Method excludes GET filter if you need to review read-only activity.
What each entry shows
The audit log table includes:- Timestamp: when Porter received the request, shown in your browser’s time zone.
- Actor: the user or API token that made the request. CLI activity is marked with a
CLIbadge. - Method: the HTTP method, such as
POST,PATCH,PUT, orDELETE. - Status: the HTTP response status code returned by Porter.
- Resource: the Porter resource associated with the request, such as an application, cluster, datastore, environment group, project, cloud account, API token, integration, or user.
- Action: a human-readable action name. For requests made by the Porter CLI, the Action column shows the specific command that ran, such as
porter kubectl,porter helm,porter app run,porter logs,porter datastore connect, orporter update. A terminal icon marks rows that carry a reported CLI command so you can scan for them quickly. Requests without a reported command fall back to the generic action name. Hover over the action to view the CLI command, the generic action, and the underlying request path.
The originating CLI command is captured for new entries only. Audit log entries recorded before this feature shipped continue to display the generic action name.
Filter audit logs
Audit logs are available for the last 30 days. Use the Date range filter to choose a preset, such as the last hour, last 24 hours, last 7 days, or last 30 days, or select a custom date and time range. You can filter by:- Actor
- Method
- Source
- Date range
- Action
- Status code
- Resource type
- Application
- Cluster
DELETE requests or exclude a noisy application while reviewing the rest of the project.
Use the search field to search across matching audit entries. Search can match request paths, user email addresses, API token names, application names, cluster names, and the reported Porter CLI command. For example, type kubectl to surface entries triggered by porter kubectl.
The volume chart above the table shows activity over the selected range. Select part of the chart to narrow the table to that time window.
Share a filtered view
Filters, search, date range, and pagination are stored in the page URL. Copy the URL from your browser to share the same audit log view with another project admin.Export audit logs
If audit log export is enabled for your project, the Export button appears above the table. Exports use the current date range and supported table filters, including actor, method, action, status code, resource type, application, cluster, and search. Exports include the originating CLI command alongside the standard columns, so you can trace which command triggered each request in your compliance reviews. You can download matching entries as:.csv.ndjson
Troubleshooting
I cannot see the Audit logs tab
Only project admins can view audit logs. Ask a project admin to update your role, or have an admin export the entries you need.I expected to see read-only requests
The dashboard appliesMethod excludes GET by default when opening audit logs from the Security navigation. Clear that filter to include GET requests.